

Britain’s motoring data, all in one place.
Cars. Roads. Drivers. Real statistics for a better view of UK motoring.
Browse by topic
The UK at a glance
- 33.8 million licensed cars in Great Britain up 1.5% vs a year earlier DfT / DVLA · End of June 2026
- 27.2% of car MOTs fail first time down 0.5 pts vs 2024 DVSA · 2025
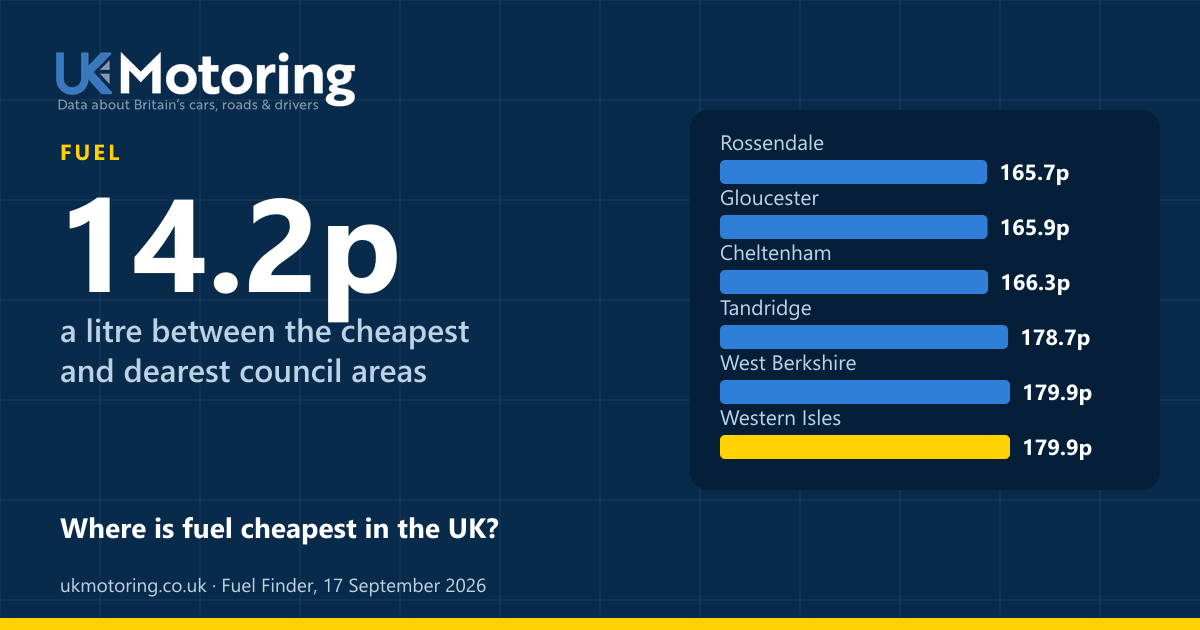
- 174.9p UK average petrol price per litre down 0.1p vs yesterday Fuel Finder, ONS · 6 October 2026
- 121,171 public EV charging devices in the UK up 10% vs a year earlier DfT · 1 July 2026
- 343 billion vehicle miles driven on GB roads up 1.9% vs 2024 DfT · 2025
Explore UK motoring data
Check a vehicle
PreviewChecks by registration are coming soon. A free check by make, model and year works now.
Try the free model checkFuel prices near you
The cheapest forecourts near you, from prices every UK filling station reports to the government’s Fuel Finder scheme.
Most popular cars
View all most popular cars| Rank | Model | Licensed | Change on a year earlier |
|---|---|---|---|
| 1 | 1,234,335 | −5.3% | |
| 2 | 899,678 | −1.8% | |
| 3 | 894,465 | −3.2% | |
| 4 | 842,798 | −6.8% | |
| 5 | 685,884 | +2.5% |
Source:DfT / DVLA End of June 2026 Updated
MOT pass rates by car age
View more mot pass rates by car age| Vehicle age | First-time pass rate |
|---|---|
| 3 years | 89.5% |
| 4–5 years | 87.6% |
| 6–7 years | 83.0% |
| 8–10 years | 75.7% |
| 11–14 years | 65.5% |
| 15–19 years | 58.0% |
| 20+ years | 61.0% |
Older cars are more likely to fail. The most common reasons are lamps, suspension and tyres.
Source:DVSA,UK Motoring analysis 2025 Updated
Latest from UK Motoring
View all latest from uk motoring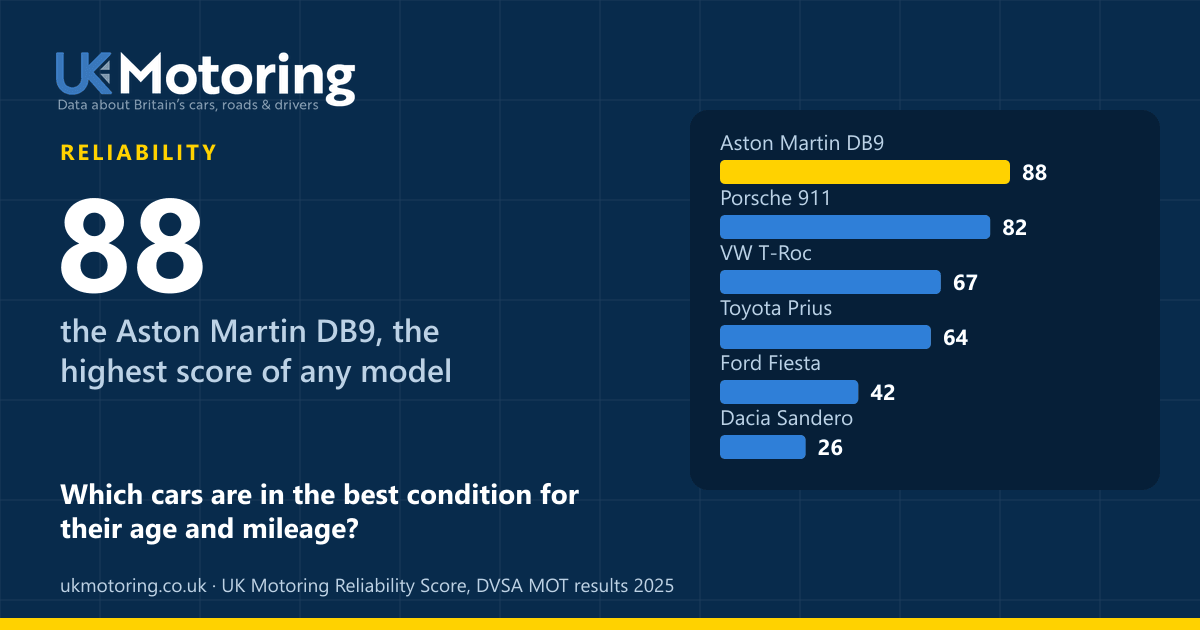
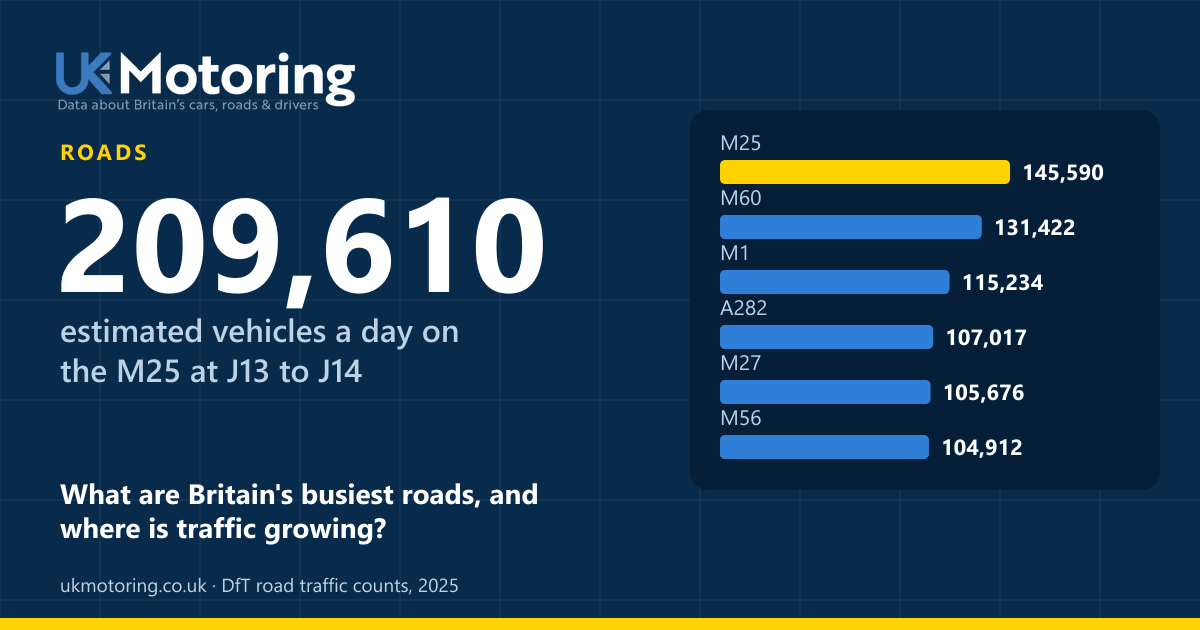
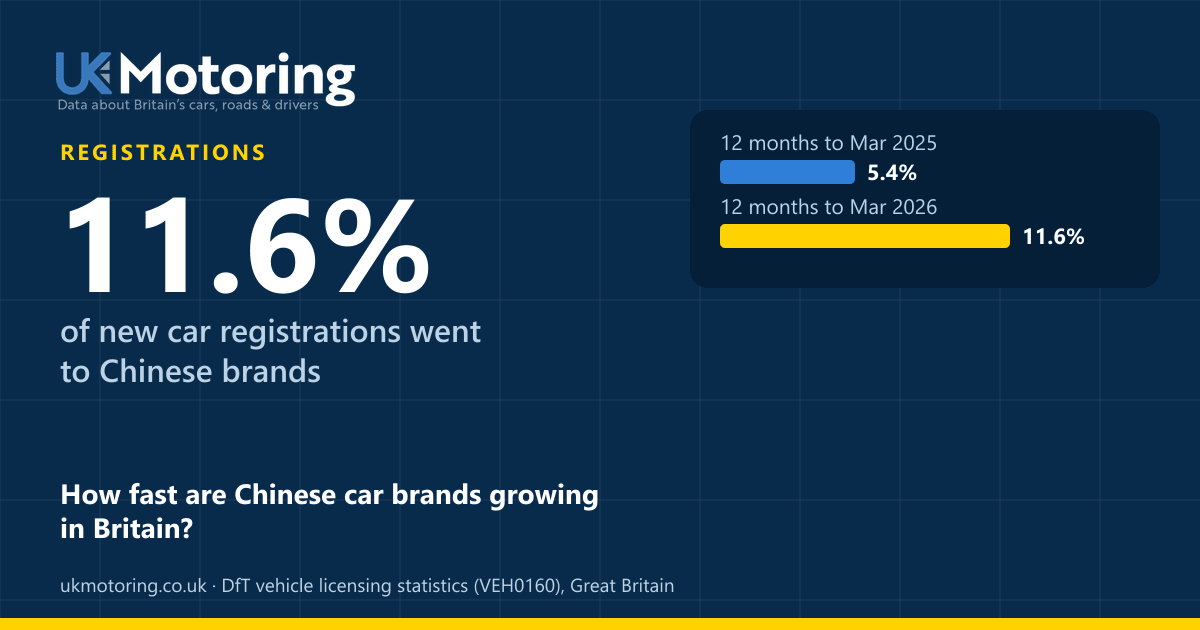
Trusted data. Real insights. A better driving Britain.
We combine official UK government data with careful analysis to give you clear, useful motoring statistics, with the source and date shown on every figure.