
Northern Ireland · Council area
Armagh City, Banbridge and Craigavon motoring statistics
How many cars and electric cars are registered in Armagh City, Banbridge and Craigavon, which fuels they use, how many public chargers there are and how Armagh City, Banbridge and Craigavon compares with Northern Ireland. From DVLA licensing records, DfT charger statistics and ONS population estimates.
- Licensed cars 128,474 +2.0% on a year earlier
- Private cars per 1,000 people 537 UK 444
- Battery electric cars 2,672 2.1% of cars (UK 5.8%)
- Electric share of private cars 1.2% 7th lowest of 361 councils
- Public chargers 103 46 per 100,000 people (UK 175)
- Company-registered cars 7.0% UK 10.0%
How many cars are there in Armagh City, Banbridge and Craigavon?
There were 128,474 licensed cars in Armagh City, Banbridge and Craigavon at the end of June 2026, and 162,140 licensed vehicles of all kinds. That is 23.5% more cars than in 2015. Privately kept cars work out at 537 for every 1,000 residents, 88th highest of 361 councils (UK 444).
Licensed vehicles in Armagh City, Banbridge and Craigavon
Counts at the end of March each year, 2015 to 2026.
| Year | All vehicles | Cars |
|---|---|---|
| 2015 | 125,780 | 104,030 |
| 2016 | 129,549 | 106,969 |
| 2017 | 134,508 | 110,472 |
| 2018 | 137,725 | 112,935 |
| 2019 | 141,196 | 115,350 |
| 2020 | 140,828 | 115,118 |
| 2021 | 148,016 | 119,128 |
| 2022 | 148,960 | 119,176 |
| 2023 | 151,631 | 120,918 |
| 2024 | 154,524 | 123,079 |
| 2025 | 158,660 | 125,989 |
| 2026 | 162,140 | 128,474 |
Source:DfT / DVLA End of June 2026 Updated
Licensed vehicles by type
Source:DfT / DVLA End of June 2026 Updated
Cars per 1,000 residents
All licensed cars at the end of June, divided by the ONS mid-year population. Company fleets registered locally push this up.
| Year | Armagh City, Banbridge and Craigavon | Northern Ireland | United Kingdom |
|---|---|---|---|
| 2015 | 499 | 491 | 473 |
| 2016 | 507 | 500 | 480 |
| 2017 | 520 | 511 | 488 |
| 2018 | 526 | 516 | 490 |
| 2019 | 531 | 522 | 493 |
| 2020 | 528 | 521 | 489 |
| 2021 | 544 | 534 | 493 |
| 2022 | 541 | 532 | 489 |
| 2023 | 545 | 537 | 489 |
| 2024 | 553 | 543 | 490 |
Source:ONS Mid-2024 Updated
Petrol, diesel and electric cars in Armagh City, Banbridge and Craigavon
35.7% of cars in Armagh City, Banbridge and Craigavon run on petrol and 53.7% on diesel. Diesel’s share peaked at 60.8% in 2021. Hybrids that do not plug in make up 6.6%, and cars that plug in 3.1%.
Cars by fuel type
Source:DfT / DVLA End of June 2026 Updated
Fuel mix over time
Share of licensed cars at the end of March each year.
| Year | Petrol | Diesel | Hybrid | Battery electric | Plug-in hybrid |
|---|---|---|---|---|---|
| 2015 | 42.3% | 57.3% | 0.2% | 0.0% | 0.0% |
| 2016 | 41.1% | 58.4% | 0.3% | 0.1% | 0.0% |
| 2017 | 40.0% | 59.5% | 0.3% | 0.1% | 0.0% |
| 2018 | 39.2% | 60.1% | 0.4% | 0.1% | 0.0% |
| 2019 | 38.9% | 60.2% | 0.6% | 0.1% | 0.1% |
| 2020 | 38.3% | 60.6% | 0.8% | 0.2% | 0.1% |
| 2021 | 37.4% | 60.8% | 1.2% | 0.3% | 0.2% |
| 2022 | 37.0% | 60.2% | 1.8% | 0.4% | 0.2% |
| 2023 | 36.9% | 59.1% | 2.5% | 0.7% | 0.3% |
| 2024 | 36.6% | 57.6% | 3.6% | 1.0% | 0.5% |
| 2025 | 36.2% | 56.0% | 4.9% | 1.4% | 0.7% |
| 2026 | 35.7% | 53.7% | 6.6% | 2.1% | 1.0% |
Source:DfT / DVLA End of June 2026 Updated
Electric cars in Armagh City, Banbridge and Craigavon
2,672 battery electric cars were licensed in Armagh City, Banbridge and Craigavon at the end of June 2026, 2.1% of all cars, 8th lowest of 361 councils. With plug-in hybrids, 3,961 cars plug in. A year earlier there were 1,797.
Of the privately kept cars, which are registered at home addresses, 1.2% are battery electric (1,491 cars), 6th lowest of 11 councils in Northern Ireland. Companies keep 44.2% of the area’s battery electric cars, against 7.0% of its cars overall. There are also 77 battery electric vans.
Battery electric share of licensed cars
End of March each year. Fleet re-registrations can move a single area’s line sharply.
| Year | Armagh City, Banbridge and Craigavon | Northern Ireland | United Kingdom |
|---|---|---|---|
| 2016 | 0.1% | 0.1% | 0.1% |
| 2017 | 0.1% | 0.1% | 0.1% |
| 2018 | 0.1% | 0.1% | 0.1% |
| 2019 | 0.1% | 0.1% | 0.2% |
| 2020 | 0.2% | 0.2% | 0.4% |
| 2021 | 0.3% | 0.3% | 0.8% |
| 2022 | 0.4% | 0.6% | 1.5% |
| 2023 | 0.7% | 1.1% | 2.3% |
| 2024 | 1.0% | 1.6% | 3.2% |
| 2025 | 1.4% | 2.3% | 4.4% |
| 2026 | 2.1% | 3.1% | 5.8% |
Source:DfT / DVLA End of June 2026 Updated
Public EV chargers in Armagh City, Banbridge and Craigavon
There were 103 public chargers in Armagh City, Banbridge and Craigavon on 1 July 2026, 29 of them rapid or ultra-rapid (50kW and above). That is 46 for every 100,000 residents, 4th lowest of 361 councils, against 175 across the UK. The count rose 2.0% from 1 January 2026.
For every public charger there are 23.1 privately kept plug-in cars in Armagh City, Banbridge and Craigavon (UK 12.9), 103rd most of 361 councils. A higher number means more competition for each public charger, though many drivers charge at home.
Public chargers
| Date | All public chargers | 50kW and above |
|---|---|---|
| Jan 2026 | 101 | 27 |
| Apr 2026 | 101 | 29 |
| Jul 2026 | 103 | 29 |
Source:DfT 1 July 2026 Updated
Chargers per 100,000 residents
| Area | All chargers | 50kW and above |
|---|---|---|
| Armagh City, Banbridge and Craigavon | 46 | 13 |
| Northern Ireland | 60 | 19 |
| UK | 175 | 42 |
Source:DfT 1 July 2026 Updated
How Armagh City, Banbridge and Craigavon compares
| Armagh City, Banbridge and Craigavon | 537 | 2.1% | 46 |
|---|---|---|---|
| Northern Ireland | 504 | 3.1% | 60 |
| United Kingdom | 444 | 5.8% | 175 |
Private cars per 1,000 people use the ONS mid-2024 population. Chargers are counted at the latest date; plug-in cars at the end of June 2026.
Councils in Northern Ireland
Sorted by battery electric share of cars. Select a column heading to sort by it.
| Belfast | 347 | 6.6% | 78 |
|---|---|---|---|
| Antrim and Newtownabbey | 523 | 4.3% | 66 |
| Lisburn and Castlereagh | 547 | 3.6% | 67 |
| Ards and North Down | 558 | 2.9% | 49 |
| Mid and East Antrim | 548 | 2.2% | 54 |
| Armagh City, Banbridge and Craigavon | 537 | 2.1% | 46 |
| Newry, Mourne and Down | 540 | 1.8% | 56 |
| Causeway Coast and Glens | 539 | 1.6% | 66 |
| Derry City and Strabane | 491 | 1.6% | 44 |
| Mid Ulster | 536 | 1.4% | 52 |
| Fermanagh and Omagh | 568 | 1.1% | 71 |
Data stories to read next
Data sources and methodology
| Figures | Source | Period | Records | Updated |
|---|---|---|---|---|
| Licensed vehicles | Vehicle licensing statistics Department for Transport | End of June 2026 | 162,140 licensed vehicles in Armagh City, Banbridge and Craigavon | 26 October 2026 |
| Plug-in and electric vehicles | Vehicle licensing statistics Department for Transport | End of June 2026 | 4,075 plug-in vehicles | 26 October 2026 |
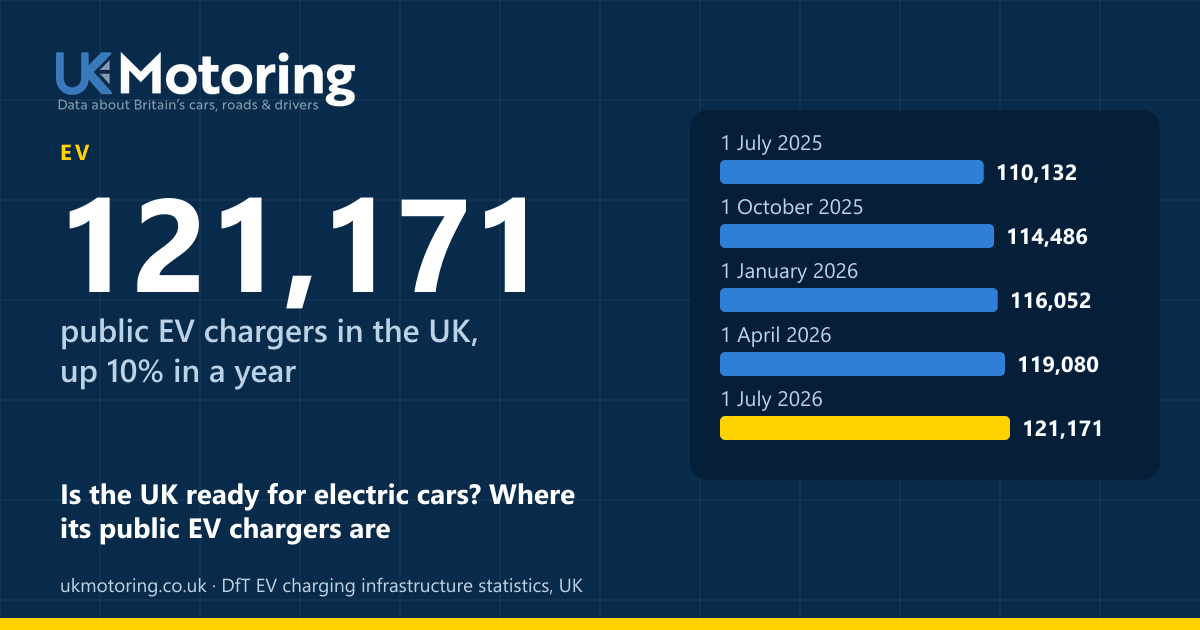
| Public chargers | Electric vehicle public charging infrastructure statistics Department for Transport | 1 July 2026 | 121,171 public chargers (UK) | 26 October 2026 |
| Population | Mid-year population estimates Office for National Statistics | Mid-2024 | 404 areas | 26 October 2026 |
- Coverage: licensing and charger figures cover the whole UK. Licensing figures for Northern Ireland start in September 2014, so UK and Northern Ireland trends begin in 2015.
- Vehicles are counted at the registered keeper’s postcode: for company cars that is the company’s address, not where the car is driven.
- Battery electric and plug-in counts come from table VEH0142; petrol, diesel and hybrid counts from VEH0105. “Other fuels” is VEH0105’s other-fuel count less plug-in cars.
- Charger counts are based on Zapmap data and are official statistics in development. In June 2026 one operator removed about 1,270 private chargers wrongly listed as public, so April and July are not strictly comparable.
Contains public sector information licensed under the Open Government Licence v3.0.
Source: Office for National Statistics licensed under the Open Government Licence v3.0.