
Driving tests
Car theory test pass rates
How many people pass the car theory test, from DVSA's published figures: 44.9% in 2025/26. By age, by gender and at every theory test centre in Great Britain.
What is the theory test pass rate?
44.9% of car theory tests were passed in April 2025 to March 2026: 1,311,480 passes from 2,924,430 tests. So far in 2026/27 the rate is 44.0%.
- Theory pass rate, 2025/26 44.9% 2,924,430 tests
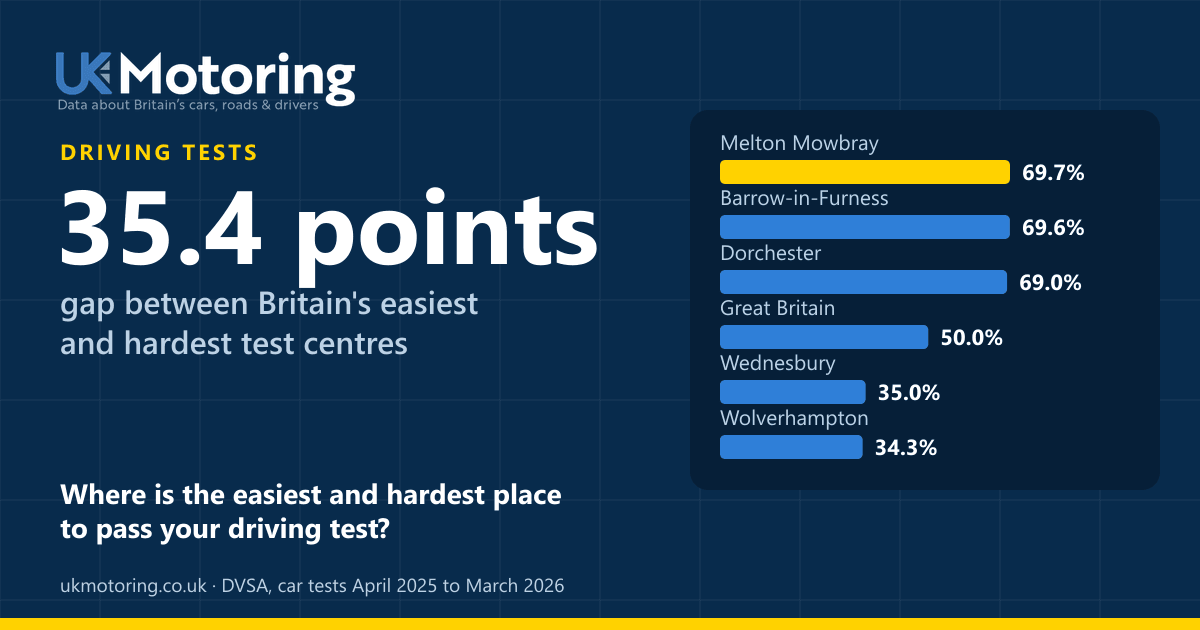
- Practical pass rate 50.0% the same year
- 17-year-olds 51.1% the best of any age
- Practical goes to pass 1.99 average, where a pass happened
- Highest centre 67.0% Bath
- Lowest centre 37.6% Bradford
A theory test is one sitting of both parts, the multiple-choice questions and hazard perception. Figures cover Great Britain: DVSA does not test in Northern Ireland.
Is the theory test getting harder?
The pass rate was 65.4% in 2007/08 and 44.9% in 2025/26, with 55.7% five years ago. The test itself has changed over that time, so this is a record of outcomes rather than of difficulty alone.
Theory test pass rate by year
Financial years, April to March. The question bank and the hazard perception section have both changed since 2007.
| Year | Pass rate |
|---|---|
| 2007/08 | 65.4% |
| 2008/09 | 65.4% |
| 2009/10 | 63.8% |
| 2010/11 | 63.1% |
| 2011/12 | 60.8% |
| 2012/13 | 59.1% |
| 2013/14 | 51.7% |
| 2014/15 | 51.0% |
| 2015/16 | 49.3% |
| 2016/17 | 48.7% |
| 2017/18 | 48.7% |
| 2018/19 | 47.3% |
| 2019/20 | 47.1% |
| 2020/21 | 55.7% |
| 2021/22 | 50.1% |
| 2022/23 | 44.2% |
| 2023/24 | 45.2% |
| 2024/25 | 44.9% |
| 2025/26 | 44.9% |
Source:DVSA 2025/26 Updated
Tests each month
Bookings rise ahead of summer and fall away over Christmas.
| Month | Tests |
|---|---|
| 2024-07 | 240,682 |
| 2024-08 | 237,154 |
| 2024-09 | 214,384 |
| 2024-10 | 239,345 |
| 2024-11 | 244,976 |
| 2024-12 | 203,183 |
| 2025-01 | 221,116 |
| 2025-02 | 238,429 |
| 2025-03 | 266,608 |
| 2025-04 | 245,268 |
| 2025-05 | 241,387 |
| 2025-06 | 247,644 |
| 2025-07 | 259,025 |
| 2025-08 | 257,843 |
| 2025-09 | 245,631 |
| 2025-10 | 256,000 |
| 2025-11 | 239,062 |
| 2025-12 | 206,580 |
| 2026-01 | 219,148 |
| 2026-02 | 240,943 |
| 2026-03 | 265,899 |
| 2026-04 | 241,298 |
| 2026-05 | 236,917 |
| 2026-06 | 257,576 |
Source:DVSA 2025/26 Updated
Pass rates by age, and by gender
17-year-olds pass most often, at 51.1%, and the rate falls with age to 36.0% for 55-year-olds. Over the last twelve months women passed 47.1% of their tests and men 42.9%.
Theory test pass rate by age
DVSA groups older candidates into bands. Unknown ages, mostly non-DVLA licences, are left out.
| Age | Pass rate |
|---|---|
| 16 2,242 tests | 40.2% |
| 17 694,029 tests | 51.1% |
| 18 262,871 tests | 40.1% |
| 19 172,796 tests | 42.1% |
| 20 131,839 tests | 44.4% |
| 21 117,781 tests | 47.6% |
| 22 107,851 tests | 48.9% |
| 23 99,452 tests | 46.7% |
| 24 95,045 tests | 45.2% |
| 25 95,324 tests | 43.9% |
| 26 91,683 tests | 43.9% |
| 27 88,802 tests | 43.5% |
| 28 85,993 tests | 43.4% |
| 29 80,493 tests | 43.5% |
| 30 75,127 tests | 43.0% |
| 31 69,260 tests | 43.1% |
| 32 63,920 tests | 42.7% |
| 33 58,806 tests | 42.7% |
| 34 53,415 tests | 42.9% |
| 35 51,073 tests | 42.4% |
| 36 46,827 tests | 41.9% |
| 37 43,517 tests | 41.7% |
| 38 40,073 tests | 41.4% |
| 39 36,394 tests | 40.8% |
| 40 32,998 tests | 40.3% |
| 41 29,644 tests | 39.5% |
| 42 26,839 tests | 39.3% |
| 43 23,368 tests | 39.6% |
| 44 20,639 tests | 38.3% |
| 45 19,050 tests | 37.6% |
| 46 16,007 tests | 38.4% |
| 47 13,419 tests | 37.1% |
| 48 11,492 tests | 36.6% |
| 49 10,254 tests | 36.7% |
| 50 8,981 tests | 36.0% |
| 51 7,418 tests | 36.1% |
| 52 6,191 tests | 37.1% |
| 53 5,492 tests | 37.0% |
| 54 4,725 tests | 37.7% |
| 55 4,255 tests | 36.0% |
| 56 3,473 tests | 37.5% |
| 57 2,862 tests | 37.2% |
| 58 2,477 tests | 38.2% |
| 59 1,971 tests | 36.7% |
| 60 and over 8,262 tests | 38.5% |
| Total 2,924,430 tests | 44.8% |
Source:DVSA 2025/26 Updated
How many attempts does it take?
DVSA publishes no figures for theory test attempts. For the practical test it does: passing took 1.99 goes on average in 2025/26, and 49.7% of all passes came at the first attempt.
| Attempt | Tests | Passes | Pass rate |
|---|---|---|---|
| First | 984,415 | 497,361 | 50.5% |
| 2 | 495,742 | 252,013 | 50.8% |
| 3 | 245,449 | 122,356 | 49.9% |
| 4 | 124,606 | 60,782 | 48.8% |
| 5 | 65,070 | 31,029 | 47.7% |
| 6 or more | 83,339 | 36,502 | 43.8% |
The average counts DVSA's last band, "6 or more", as six, so the true figure is a little higher. A theory test pass is valid for two years, so a candidate who takes longer than that to pass the practical has to sit the theory again.
Theory test centres
Of the 198 centres with 1,000 or more tests, Bath has the highest pass rate at 67.0% and Bradford the lowest at 37.6%. Where people sit the test says more about who lives there than about the centre itself: the questions are the same everywhere.
Highest pass rates
| Centre | Pass rate |
|---|---|
| Bath 3,630 tests | 67.0% |
| Dunfermline 2,658 tests | 65.8% |
| Birkenhead 2,488 tests | 64.6% |
| Inverness2 2,342 tests | 64.6% |
| Runcorn 2,127 tests | 64.5% |
| Tunbridge Wells 1,423 tests | 64.3% |
| Basingstoke 2,908 tests | 63.9% |
| Durham 3,698 tests | 63.3% |
| Kendal2 2,995 tests | 63.2% |
| Motherwell 3,256 tests | 63.1% |
Source:DVSA 2025/26 Updated
Lowest pass rates
| Centre | Pass rate |
|---|---|
| Bradford 42,749 tests | 37.6% |
| Uxbridge 83,604 tests | 38.1% |
| Dudley 28,272 tests | 40.0% |
| Ilford 92,249 tests | 40.2% |
| Wolverhampton 36,811 tests | 40.3% |
| Boston 7,094 tests | 40.4% |
| Leicester 61,224 tests | 40.4% |
| Birmingham 78,958 tests | 40.6% |
| Haverfordwest 4,177 tests | 40.8% |
| Middlesbrough 34,351 tests | 40.9% |
Source:DVSA 2025/26 Updated
| Aberdeen | 47.8% |
|---|---|
| Aberystwyth | 49.1% |
| Aldershot | 47.8% |
| Alnwick | 46.4% |
| Andover | 48.9% |
| Andover (Portland House) | 59.4% |
| Axminster | 50.5% |
| Aylesbury | 46.9% |
| Aylesbury2 | 60.2% |
| Ayr | 44.1% |
| Bangor | 43.6% |
| Barnstaple | 45.1% |
| Barrow | 43.0% |
| Basildon | 50.3% |
| Basingstoke | 63.9% |
| Bath | 67.0% |
| Berwick | 45.6% |
| Bethnal Green | 46.9% |
| Birkenhead | 64.6% |
| Birmingham | 40.6% |
| Blackpool | 54.3% |
| Blandford Forum | 52.4% |
| Bodmin | 52.6% |
| Bolton | 41.7% |
| Boston | 40.4% |
| Bournemouth | 47.0% |
| Bradford | 37.6% |
| Bridgend | 41.4% |
| Brighton | 52.4% |
| Bristol | 48.9% |
| Bristol (Avonmouth - closed) | 53.5% |
| Bristol (closed) | 51.5% |
| Bristol (Temple Back) | 58.1% |
| Builth Wells | 46.8% |
| Burnley | 44.4% |
| Bury St Edmunds | 48.3% |
| Cambridge | 52.8% |
| Canterbury | 47.4% |
| Canterbury (Lower Bridge Street) | 55.1% |
| Cardiff | 44.9% |
| Cardigan | 41.6% |
| Carlisle | 41.7% |
| Carmarthen | 44.0% |
| Chatham | 44.1% |
| Chelmsford | 47.9% |
| Cheltenham | 50.0% |
| Cheltenham (Albion Street) | 61.3% |
| Chester | 47.6% |
| Chesterfield | 45.3% |
| Chichester | 46.7% |
| Clydebank | 62.3% |
| Clydebank (Erskine House) | 61.2% |
| Colchester | 45.1% |
| Corby | 45.1% |
| Coventry | 43.3% |
| Crawley | 61.3% |
| Crewe | 45.0% |
| Croydon | 45.8% |
| Derby | 44.7% |
| Doncaster | 41.3% |
| Dudley | 40.0% |
| Dumbarton | 42.5% |
| Dumfries | 45.3% |
| Dundee | 46.7% |
| Dunfermline | 65.8% |
| Durham | 63.3% |
| Eastbourne | 45.1% |
| Edinburgh | 49.5% |
| Elgin | 42.4% |
| Exeter | 50.6% |
| Exeter 2 | 61.0% |
| Fareham | 46.1% |
| Frome | 49.9% |
| Frome (Tucker Close) | 56.9% |
| Galashiels | 49.8% |
| Glasgow | 44.1% |
| Gloucester | 44.5% |
| Grantham | 47.8% |
| Greenock | 44.2% |
| Grimsby | 42.5% |
| Guildford | 54.0% |
| Harlow | 53.5% |
| Harrogate | 51.3% |
| Hastings | 45.2% |
| Haverfordwest | 40.8% |
| Hereford | 44.3% |
| Hertford | 46.6% |
| Holborn | 55.4% |
| Horley | 47.3% |
| Huddersfield | 42.8% |
| Hull | 42.9% |
| Ilford | 40.2% |
| Inverness | 46.7% |
| Inverness2 | 64.6% |
| Ipswich | 44.8% |
| Kendal | 51.2% |
| Kendal2 | 63.2% |
| Kings Lynn | 42.3% |
| Kingsbridge | 52.2% |
| Kingston | 56.3% |
| Launceston | 48.4% |
| Leeds | 43.3% |
| Leicester | 40.4% |
| Limehouse | 52.2% |
| Limehouse A | 52.7% |
| Limehouse B | 58.1% |
| Limehouse C | 56.8% |
| Lincoln | 45.2% |
| Liverpool | 45.6% |
| Lowestoft | 43.8% |
| Luton | 41.0% |
| Manchester | 42.5% |
| Manchester (Universal Square) | 51.5% |
| Mansfield | 49.4% |
| Merthyr Tydfil | 41.1% |
| Middlesbrough | 40.9% |
| Mile End | 51.4% |
| Milton Keynes | 46.6% |
| Morden | 51.7% |
| Morpeth | 59.7% |
| Motherwell | 63.1% |
| New Romney | 47.2% |
| Newcastle | 45.9% |
| Newport (Gwent) | 41.2% |
| Newport (Isle of Wight) | 48.9% |
| Newport-Isle Wight | 56.9% |
| Newtown | 44.9% |
| North Finchley | 43.7% |
| Northallerton | 47.0% |
| Northallerton2 | 60.7% |
| Northampton | 44.1% |
| Norwich | 47.6% |
| Norwich (Prince of Wales Road) | 57.7% |
| Norwich (Thorpe Road) | 51.2% |
| Nottingham | 46.6% |
| Oldham | 47.1% |
| Oxford | 50.5% |
| Oxford B | 55.9% |
| Penzance | 48.9% |
| Peterborough | 42.3% |
| Plymouth | 49.0% |
| Portsmouth | 43.8% |
| Preston | 43.9% |
| Reading | 49.6% |
| Redditch | 48.4% |
| Rhyl | 43.1% |
| Royal Tunbridge Wells | 53.6% |
| Runcorn | 64.5% |
| Salford | 51.5% |
| Salisbury | 50.3% |
| Salisbury 2 | 59.5% |
| Scarborough | 44.6% |
| Scunthorpe | 48.1% |
| Sheffield | 44.0% |
| Shrewsbury | 47.2% |
| Sidcup | 46.0% |
| Skipton | 52.9% |
| Skipton2 | 60.2% |
| Slough | 41.4% |
| Solihull | 63.0% |
| Southampton | 46.2% |
| Southampton (Anglo City) | 57.9% |
| Southend-On-Sea | 45.3% |
| Southgate | 49.4% |
| Southport | 53.3% |
| Southwark | 52.0% |
| Southwark - (closed) | 54.5% |
| Southwark (Shand Street) | 57.5% |
| St Helens | 53.6% |
| Staines | 46.1% |
| Stevenage | 55.5% |
| Stevenage (Middlesex House) | 58.6% |
| Stirling | 45.7% |
| Stockport | 46.0% |
| Stoke-on-Trent | 43.9% |
| Stratford uponAvon | 61.6% |
| Stratford-upon-Avon | 50.3% |
| Sunderland | 43.3% |
| Sutton Coldfield | 42.6% |
| Sutton Coldfield 2 | 55.3% |
| Swansea | 42.4% |
| Swindon | 43.5% |
| Taunton | 46.4% |
| Torquay | 49.1% |
| Truro | 50.2% |
| Tunbridge Wells | 64.3% |
| Uxbridge | 38.1% |
| Uxbridge 2 | 50.5% |
| Watford | 47.0% |
| Weymouth | 44.9% |
| Wigan | 52.8% |
| Wolverhampton | 40.3% |
| Worcester | 47.6% |
| Workington | 41.0% |
| Worthing | 46.1% |
| Wrexham | 43.7% |
| Yeovil | 45.7% |
| York | 50.6% |
Questions about the theory test
What is the theory test pass rate?
44.9% of car theory tests were passed in April 2025 to March 2026: 1,311,480 passes from 2,924,430 tests in Great Britain. In 2007/08 it was 65.4%.
How many attempts does it take to pass the theory test?
DVSA does not publish how many attempts the theory test takes, only the pass rate. It does publish attempts for the practical test: passing took 1.99 goes on average.
Which age passes the theory test most often?
17-year-olds, at 51.1%. The rate falls with age: it is 36.0% for 55-year-olds. Younger candidates tend to be revising for the test as part of learning to drive from scratch.
Do men or women pass the theory test more often?
Over the last twelve months of published figures, women passed 47.1% of their theory tests and men 42.9%. It is the opposite way round from the practical test, where men pass more often.
Why is the theory pass rate lower than the practical?
Almost anyone can book a theory test, and many sit it early in their learning, while a practical test usually comes after an instructor thinks a candidate is ready. In 2025/26 the theory rate was 44.9% against 50.0% for the practical.
What does the theory test involve?
Two parts in one sitting: 50 multiple-choice questions, where 43 correct is a pass, and the hazard perception clips. Both parts must be passed on the same visit, and DVSA counts the whole sitting as one test in these figures.
Data stories to read next
Data sources and methodology
| Figures | Source | Period | Records | Updated |
|---|---|---|---|---|
| Theory test statistics | Driving test and theory test data (DRT tables) Driver and Vehicle Standards Agency | 2025/26 | 2,924,430 car theory tests in 2025/26 | 18 September 2026 |
- Car theory tests (category B) in financial years, April to March. A test is one sitting of both parts, so a candidate who fails the hazard perception counts once.
- Total tests can be higher than male plus female, because a candidate’s gender is not always recorded. Small age groups are combined, and unknown ages are candidates with a licence not issued by DVLA.
- Figures from April 2025 are provisional until the year is finalised. During Covid restrictions DVSA combined some quarters to avoid identifying individuals.
- Centre figures are for the last year each centre has published tests, and centres with fewer than 1,000 tests are left out of the comparison.
- Attempt figures are for the practical test (DRT121D): DVSA publishes no attempt figures for the theory test.
Contains public sector information licensed under the Open Government Licence v3.0.